


Every month, IT teams walk into leadership meetings armed with detailed reports – uptime statistics, incident logs, SLA compliance charts, performance dashboards, and infrastructure analysis.
The data is accurate.
The effort is important.
Reporting is complete.
But when the presentation is over, many business leaders are left with a silent question:
What does all this mean for our business?
Does it contribute to revenue growth?
Does it reduce operational risk?
Does it improve the customer experience?
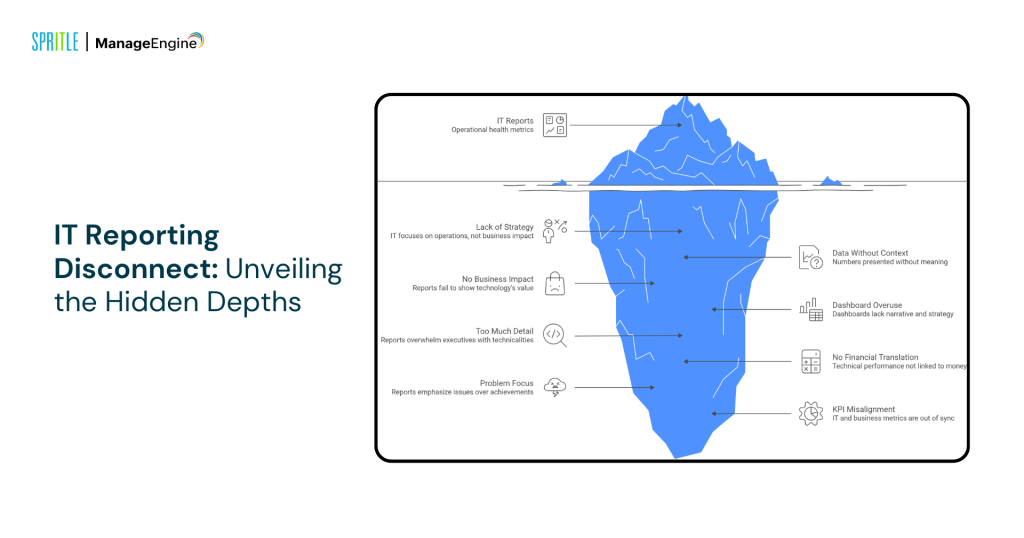
This is where most IT reporting breaks down.
The problem is not poor performance or lack of knowledge. The real problem wrong connection. Traditional IT reports are designed for teams of professionals who manage systems on a daily basis, while managers make decisions based on business results, financial impact, and strategic direction.
IT is about metrics.
Leadership thinks about value.
Modern IT management platforms like ManageEngine help organizations close this gap by turning technical data into meaningful business intelligence. But tools alone are not enough – reporting must evolve from performance reviews to meaningful storytelling.
Understanding why IT reports fail to engage with business leaders is the first step in transforming IT from a support function to a true business enabler.
Let’s examine the main reasons behind this disconnection.


1. Too Technical, Not Strategic
IT teams focus on operational health because infrastructure stability is their responsibility. However, managers evaluate technology for business impact.
Common IT report metrics include:
- CPU usage
- Latency spikes
- Status of patch deployment
- Mean Time to Resolution (MTTR)
- Server response performance
These metrics are important internally but rarely explain organizational results.
Business leaders instead focus on:
- Income protection
- Customer experience
- Continuity of work
- Compliance risks
- Product reputation
👉 Termination:
IT reports describe system health, while leadership assesses business performance.
For example
- ❌ “99.9% uptime achieved.”
- ✔ “No service interruption during peak customer purchases.”
Technology only becomes meaningful when it is translated into results.
2. Data Out of Context
Many IT reports present large amounts of data without explaining what the numbers mean.
Example:
- Ticket prices increased by 18%.
Without context, leadership cannot determine whether this represents progress or danger.
Managers quickly ask themselves:
- Have performance problems increased?
- Did business growth create more demand?
- Is a new product being launched?
Effective reporting should always include:
- Business content behind metrics
- Comparison of trends with previous periods
- Definitions of performance or growth
- Risk indicators derived from statistics
Dashboards display information, however context brings understanding.
3. No Obvious Business Impact
Managers want to understand how technology supports organizational success.
They typically test IT through:
- To increase strength
- Cost optimization
- Risk reduction
- Productivity improvement
However, most reports stop at performance updates.
A common reporting gap
- ❌ “There have been three serious incidents.”
- ✔ “The three incidents caused two hours of downtime, affected 1,200 users and jeopardized ₹8 lakhs in potential revenue.”
Strong IT reporting solutions:
- Why is this important?
- What is the financial impact?
- What action is required?
When the business impact is clear, IT reporting becomes a decision-making tool.
4. Overuse of Dashboards, Underuse of Storytelling
Modern IT platforms produce advanced dashboards full of graphs and statistics. But dashboards alone rarely communicate strategy.
Business leaders prefer clear answers to these:
- Are the systems secure?
- Is the performance stable?
- Can technology scale with growth?
An effective IT report should follow a narrative structure:
- Current operating status
- Important risks have been identified
- Performance trends
- Development opportunities
- Recommended next steps
Data informs decisions – storytelling drives insight.
5. Too Much Detail, Not Enough Summary
IT professionals value technical depth, but managers need clarity and speed.
Leadership teams typically expect answers to:
- What has changed this month?
- What risks were mitigated?
- How much did it cost?
- What investment is needed next?
Best practice today layered reporting:
- Executive view → Tactical summary
- IT manager view → Operational performance
- Engineering view → Technical diagnostics
Different stakeholders need different levels of detail from the same data.
6. No Financial Translation
One major weakness in traditional IT reporting is the lack of financial interpretation.
When IT budgets increase, managers ask:
- What risk has decreased?
- What losses are prevented?
- What ROI was achieved?
Business-friendly reports translate technical performance into:
- Cost savings
- Income protection
- Productivity benefits
- Reducing compliance risk
Technology becomes strategic when metrics are expressed in financial language.
7. Reports Focus on Problems, Not Progress
Most IT reports emphasize problems rather than achievements.
Common areas of focus include:
- Events
- System failure
- Safety warnings
- Service delays
While transparency is important, leadership wants to see progress.
Managers respond well to:
- Automatic detection
- Quick turnaround times
- Improved stability
- Improvement of efficiency
For example
“Automated workflow reduced ticket processing time by 32%, saving approximately 140 IT hours this quarter.”
Progress metrics show business value – not just solving operational problems.
8. IT KPIs and Business KPIs Are Mistargeted
The biggest disconnect happens when IT success metrics differ from business success metrics.
IT KPIs Are Commonly Measured
- Compliance with SLA
- System time
- Termination of patch management
Business KPIs Focus On
- Customer retention
- Income growth
- Market expansion
- The effects of digital transformation
Future-proof reporting aligns both perspectives.
Business related examples
- 99.95% uptime → Lost lost sales during campaigns
- Fast incident resolution → High customer satisfaction
- Asset development → Reduced capital expenditure
When KPIs align, IT transforms into a strategic business partner.

How to Turn IT Reports into Business
1. Start with a High Summary
Put in:
- Key achievements
- Big risks
- Financial impact
- Strategic recommendations
2. Translate Metrics into Results
Example:
“Downtime reduced by 15%”
→ “Customer-facing downtime is reduced, securing high-income jobs.”
3. Show Trends, Not Snapshots
Highlight:
- Performance improvement trends
- Risk evolution
- Stability over time
4. Align Reporting with Business Strategy
Display:
- Infrastructure development
- Security maturity
- System reliability
- Customer experience readiness
5. Use IT Management Platforms Smartly
Choose the metrics leaders need instead of overwhelming them with technical data.

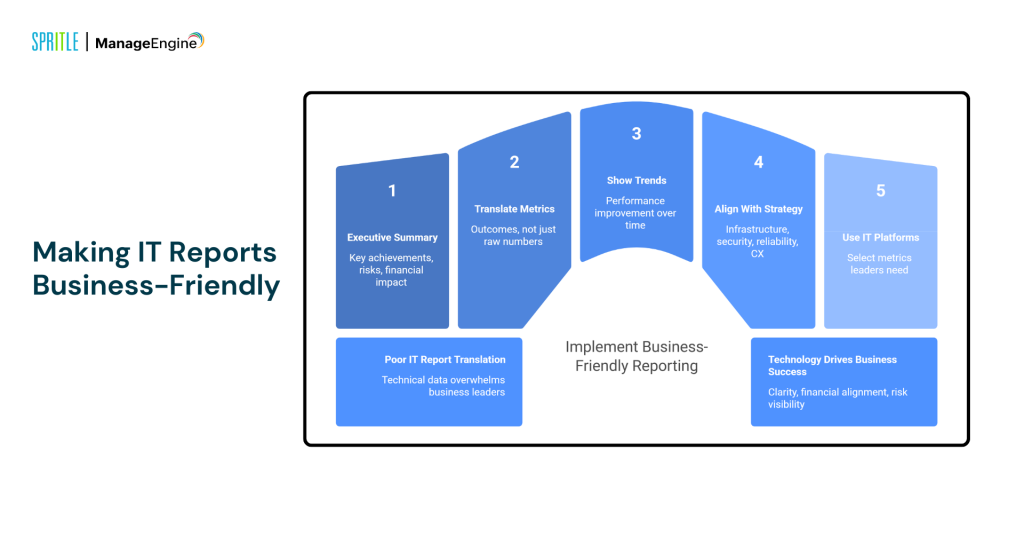
The Bottom Line
IT reports fail not because of bad data – but because of poor translation between technology and business language.
Business leaders don’t need more dashboards. They need:
- Clarity
- Financial alignment
- Risk visibility
- Strategic understanding
When IT teams communicate about business value instead of technical complexity, technology moves from a support function to a driver of growth.
Because leadership ultimately does not ask:
“How many tickets are closed?”
They ask:
“How does technology drive business success?”
That’s a really sensible IT report.


