
Will the Solana price go down now that it is charting a bearish flag pattern?

Solana’s price fell more than 7% on Monday as fears over the impact of the ongoing US-Iran war continued to drive investors away from the risky asset. Current technical signals suggest that the token may be set to decline.
Summary
- Solana’s price remains subdued as the network’s revenue declines amid an overall market downturn.
- A bearish flag pattern has placed the token in an additional low position.
According to data from crypto.news, the price of Solana (SOL) fell by 7% from $ 88.05 on Sunday to $ 81.86 on Monday, March 2. Later, it tried to break the resistance of $ 90 supported by the recovery of the broader market, but the rally lost steam below that mark.
On a month-to-month basis, Solana is down more than 30%, and down more than 44% from this year’s high.
Solana’s price has remained low as network revenues have declined. It is noteworthy that the weekly income generated by the Solaba network has decreased by more than 30% from what was recorded in mid-January, data from DeFiLlama show.
The total amount locked in the network also dropped from more than $9 billion recorded in Jan. 17 to $6.64 billion at the time of writing.
With both the network’s revenue and TVL falling, investors are concerned that Solana’s growth phase is over, and the memecoin fever that fueled the network is finally breaking.
Demand for the token across the derivatives market contributed to the decline. Data from CoinGlass shows that SOL futures open interest fell nearly 45% to $4.93 billion from its January high of $8.88 billion as traders unloaded positions awaiting signs of further calm in the political landscape.
The price of Solana is also affected by the decline in the markets due to the ongoing US-Iran conflict, which has pushed investors away from the risky asset to traditional alternatives, as they expect more volatility this week.
The latest start came after Iran’s retaliatory attack on US ships over the weekend, anchored in the Strait of Hormuz, sent oil prices soaring. Investors are concerned that this could lead to higher inflation in the US, which could force the Fed to raise interest rates or hold them steady for longer.
Risky assets like Solana tend to benefit from lower interest rate expectations and get tougher when the Fed sets a hawkish tone.
On the daily chart, the price of Solana has formed a bearish flag pattern since the token entered a downtrend from mid-January of this year, before moving to consolidation a few weeks ago. Bearish flags are usually precursors to a further downtrend.
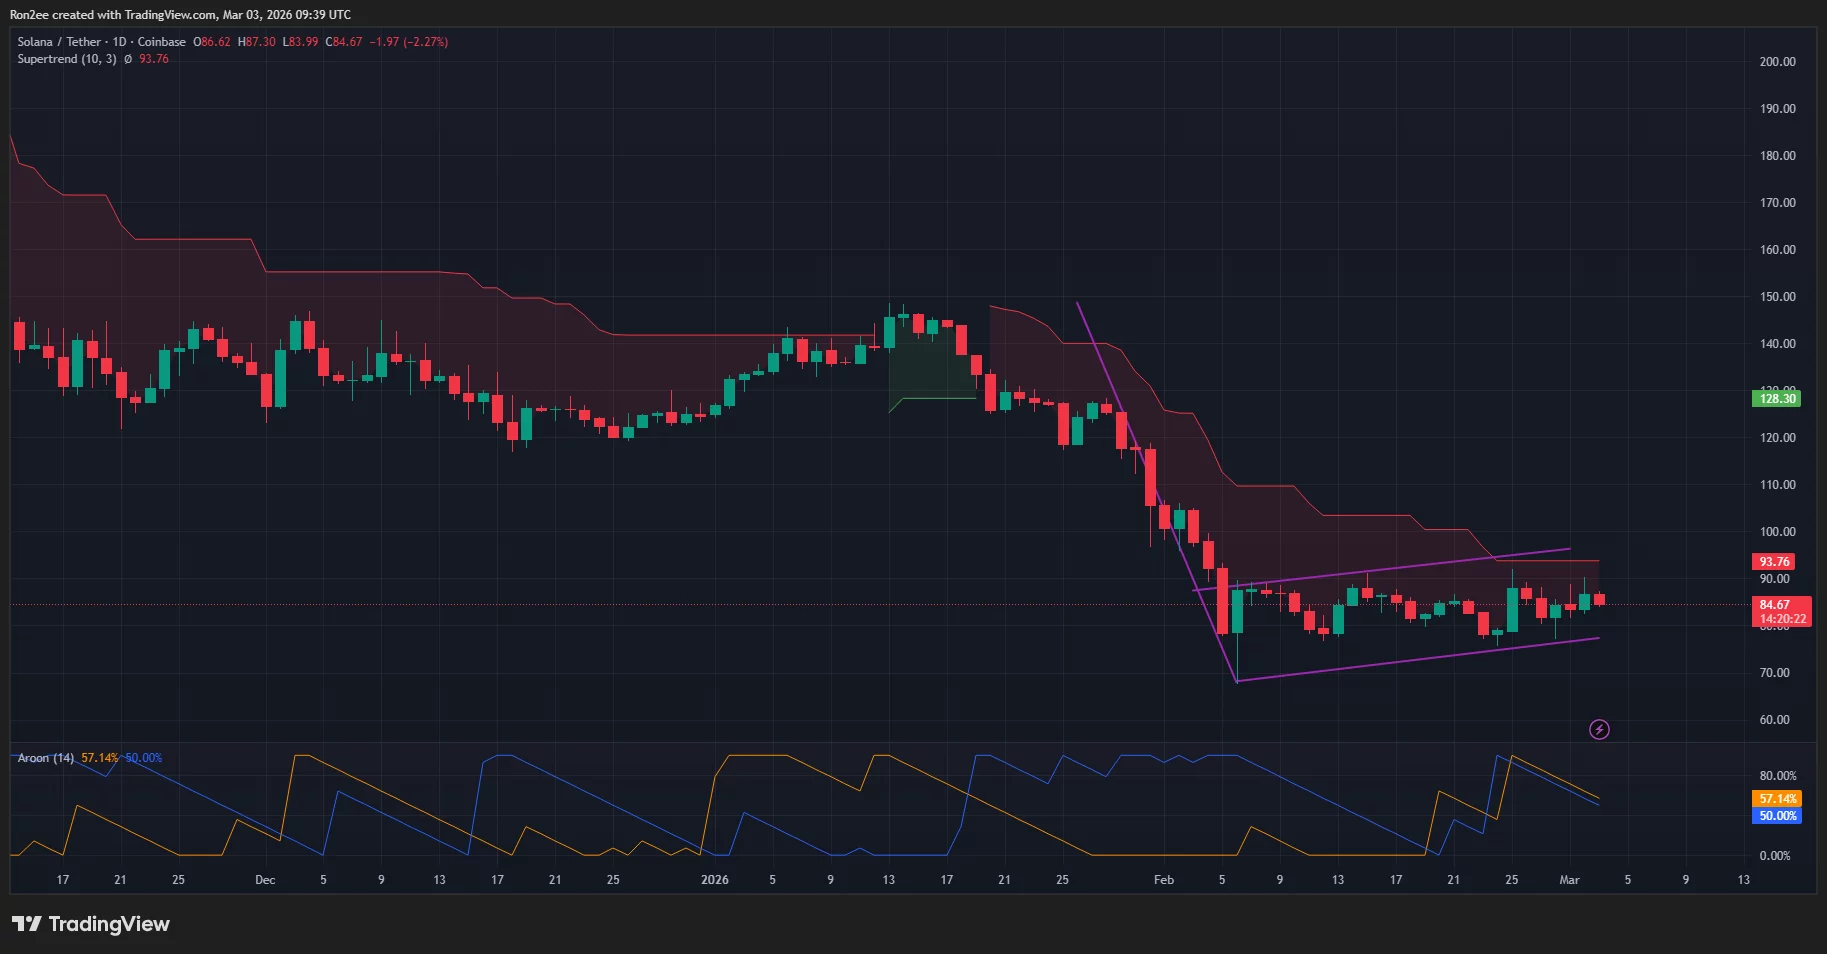
Other technical indicators are also in favor of the bears. The Supertrend has flashed red while the Aroon lines are pointing downwards, Aroon Down is at 50%, indicating that the sellers are still firmly in control of the market.
Therefore, the price of Solana is in danger of falling to Feb. 6 low of $70 if the current bearish momentum succeeds, especially considering the broader decline.
On the contrary, a rebound above $90, a resistance level that the token has struggled to break several times in the past few weeks, could provide the necessary hope for a rally towards the $100 psychological resistance level.
Disclosure: This article does not represent investment advice. The content and materials presented on this page are for educational purposes only.


