


Bitcoin fell below $64,000 on Tuesday as traders cut risk ahead of the Federal Reserve’s interest rate decision, while ETF outflows and limited selling added to selling pressure.
Summary
- Bitcoin down 2.5% and traded briefly near $63,327 during Tuesday’s session.
- US spot Bitcoin ETFs recorded $11.64 million in gross output July 27.
- BTC lost the 4-hour rising trendline, while daily RSI dropped to 48.13.
- Liquidity pools near $64,500 and $62,500 it can shape the next short-term move.
Bitcoin price is falling below the rising trendline
According to data from crypto.news, the price of Bitcoin (BTC) opened on Tuesday near $ 63,706 and extended its decline to $ 63,327 as traders reduced exposure before the Fed’s decision. BTC later traded around $63,858, down about 2.5% during the session.
The 4-hour chart shows that Bitcoin broke below the rising trendline that supported the recovery from the end of June low near $58,000. The price tried to move back above the trend line, but the rebound stopped below $64,000.
Bitcoin also stayed below the 4-hour Supertrend resistance at $65,198. The indicator will continue to favor sellers unless BTC closes above that level and turns the broken trend line into support.
The Chaikin Money Flow reading stood at minus 0.04, indicating that cash flow has turned slightly negative. While the reading does not indicate an extreme spread, it does indicate that selling pressure continues to outpace buying demand.
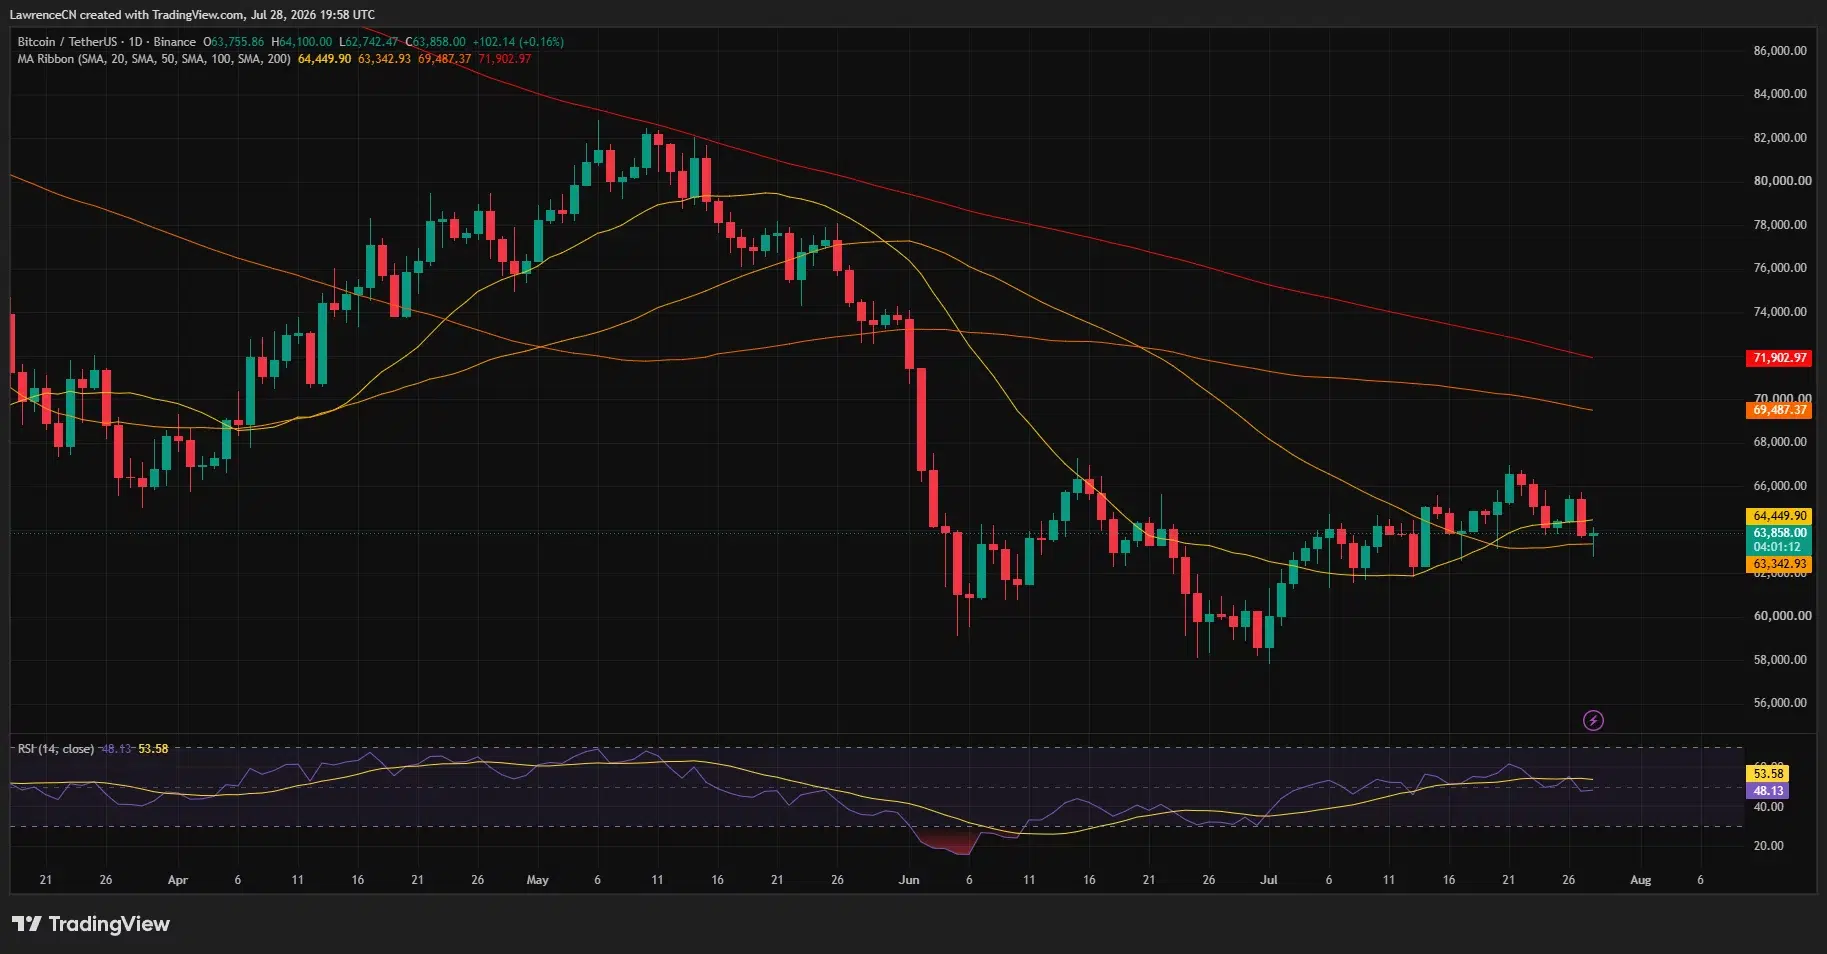
The daily Bitcoin chart presents a mixed formation. BTC traded below the 20-day moving average at $64,449 but remained above the 50-day moving average near $63,343. That leaves the price squeezed between short-term resistance and a key support level.
The Fed’s decision drives the demand for money
The Federal Reserve began its two-day meeting on July 28 and will announce its decision at 2 pm Eastern Time on Wednesday. Chairman Kevin Warsh’s press conference will follow 30 minutes later, according to the Federal Reserve’s July calendar.
Markets broadly expect policymakers to keep the federal funds rate within the current range of 3.50% to 3.75%. However, the futures price gave about a one in three chance to a rate hike, making the meeting less predictable than recent policy decisions.
A Reuters report said the margin for a quick hike remains high despite inflation concerns and hawkish comments from some policymakers. June inflation and easing political pressures support the case for holding rates steady.
An unexpected hike could strengthen the US dollar and raise Treasury yields, creating another headwind for Bitcoin and other risk assets. Holdings may ease immediate pressure, but markets could still sell off if Warsh indicates that a September hike remains possible.
So Bitcoin’s decline below $64,000 indicates more than technical weakness. Traders limit large exposures ahead of an event that could rapidly change expectations for US liquidity and borrowing costs.
US Bitcoin ETF exit adds to selling pressure
US spot Bitcoin ETFs posted $11.64 million in total outflows on July 27, marking the third consecutive session of withdrawals, according to data from SoSoValue.
BlackRock’s IBIT led the daily withdrawals with $8.82 million, while Fidelity’s FBTC lost $2.82 million. These funds still hold combined assets of about $78.71 billion, but the latest outflows reflected weak institutional demand ahead of the Fed’s announcement.
Spot Ether ETFs have gone in the opposite direction. Products attracted $9.23 million, led by $11.75 million in revenue from BlackRock’s ETHA. Invesco’s QETH partially offset that demand with a $2.52 million withdrawal.
The split suggests some US-listed fund investors favored Ether over Bitcoin during the session. However, one day of divergent flow is not enough to establish a permanent institutional rotation between two commodities.
Bitcoin liquidation map identifies key levels
The three-day closing heat map shows a large confluence of available positions between $64,400 and $64,600. A bounce in this area may result in a short close, but it also crosses over Bitcoin’s 20-day moving average and may act as resistance.
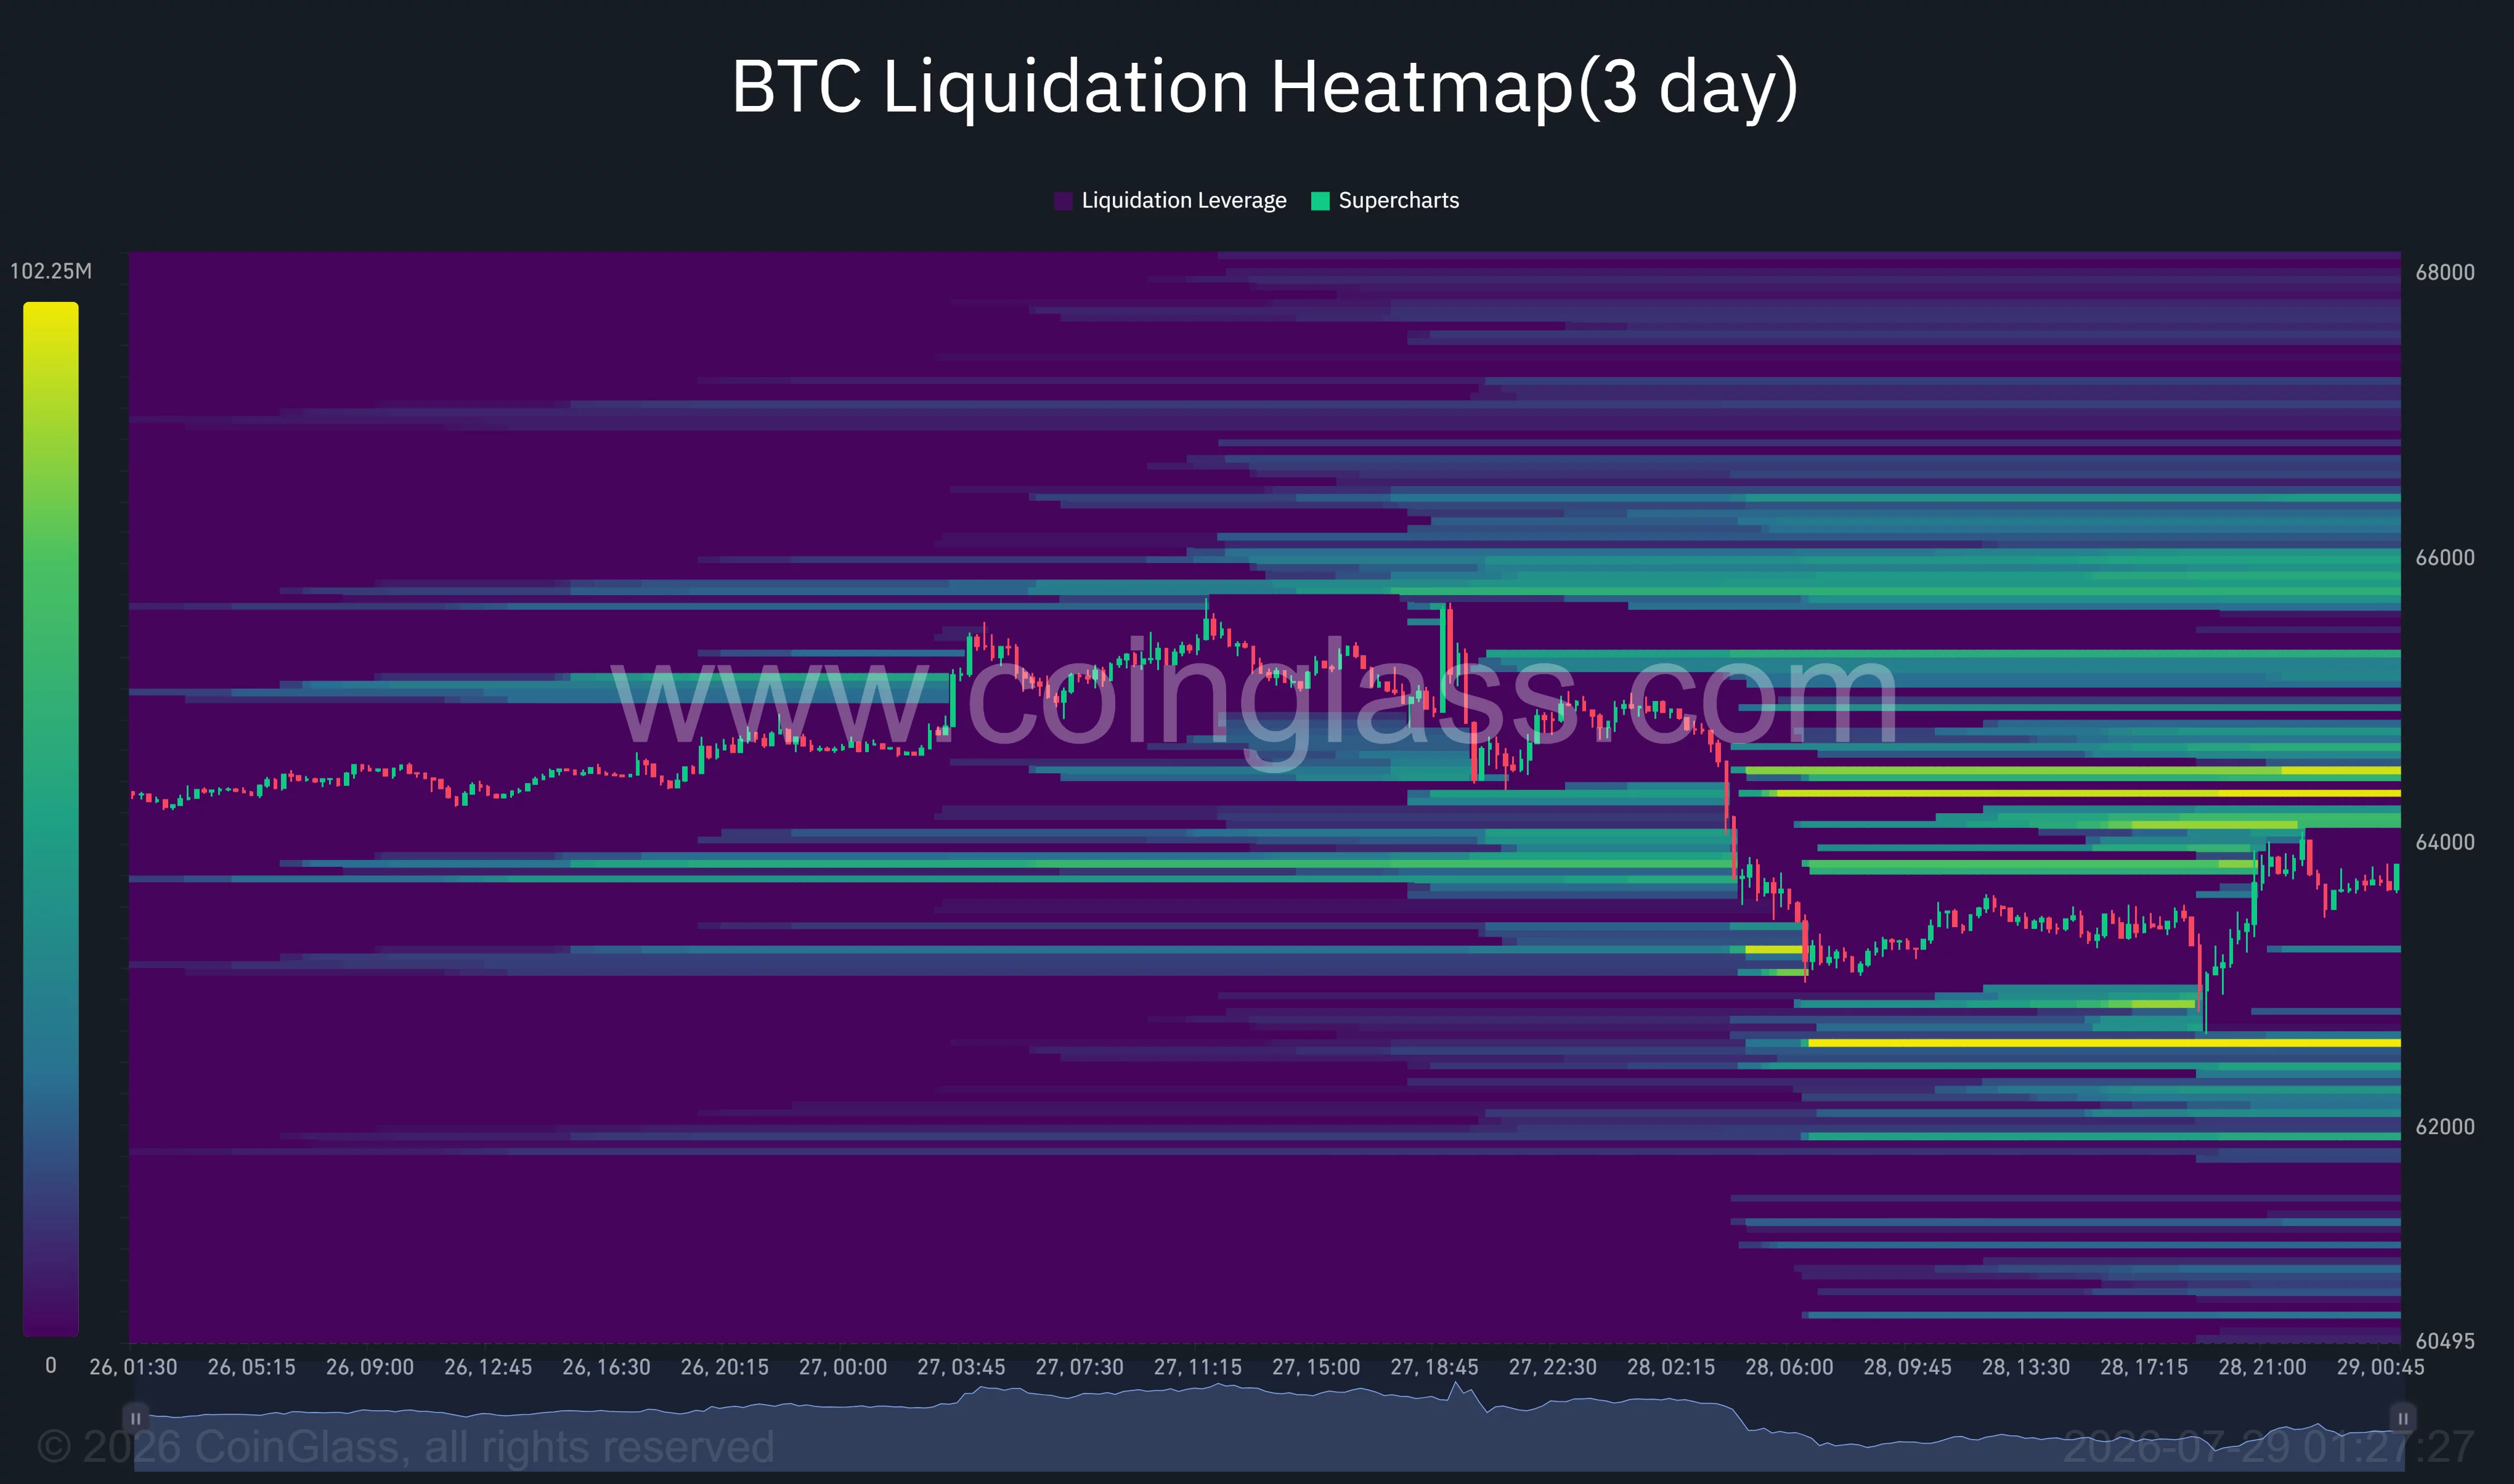
Additional liquidity remains near $65,800 to $66,200. Bitcoin will need to retrace the 4-hour Supertrend at $65,198 before that high becomes a realistic target.
At the bottom of the market, the strongest near-term liquidity concentration is seen around $62,500 to $62,600. A break below the 50-day moving average at $63,343 would pull the price into that range. Lower support is seen around $61,800 to $62,000.
Daily momentum remains neutral rather than oversold. Bitcoin’s relative strength index was 48.13, below its moving average at 53.58 and slightly below the central midpoint. The reading leaves room for more losses if traders break the 50-day moving average.
The analyst sees a $68,000 recovery in August
Crypto analyst Michaël van de Poppe has maintained a near-term bullish outlook despite Bitcoin’s recent pullback.
“I think we’ll target $68,000 in early August again, and we’ll probably break out of that soon to $75,000+.”
For that trend to strengthen, Bitcoin must first recover the $64,450 to $65,200 resistance area. A move above $66,000 would reveal the analyst’s target of $68,000.
On-chain analyst Ardi noted that the Bitcoin market price-to-realized-value ratio stands at 1.21. The level remains well above the 0.69 and 0.75 readings associated with bear market declines for 2018 and 2022, respectively.
That comparison suggests that Bitcoin has yet to reach the same level of market-wide rally seen at the bottom of the previous cycle. For US investors, Wednesday’s Fed statement and Warsh’s guidance remain immediate triggers: a hawkish surprise could reveal $62,500, while a slightly more restrictive message could help BTC reach $65,200.
Disclosure: This article does not represent investment advice. The content and materials presented on this page are for educational purposes only.